How trend is calculated for steam items.
Introduction
This article will explain the basics such that you can decide if you want to use the trend for your own purposes.
The basics
At first, we need to understand what is meant by "trend". For this we need to
take a look at something called linear regression.
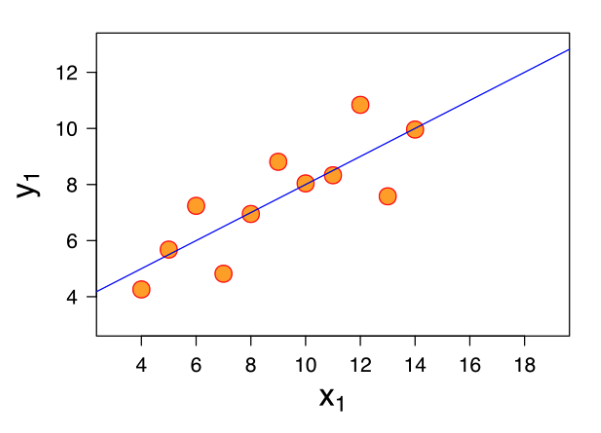
Basically, with linear regression we try to find a line that best fits the data points.
Based on this line we can see whether the observed item is increasing or decreasing in price for a specific time period.
Consider the following example:

Mapping to steam item price graph we would say that on x-axis we have time and on y-axis we have price.
One single point on the graph would represent the price of an item for which it
was sold at a specific time (later on we will show that actually this might be
more than a single item). The blue line is what we are looking for. It represents the trend of the item price.
Steam specifics
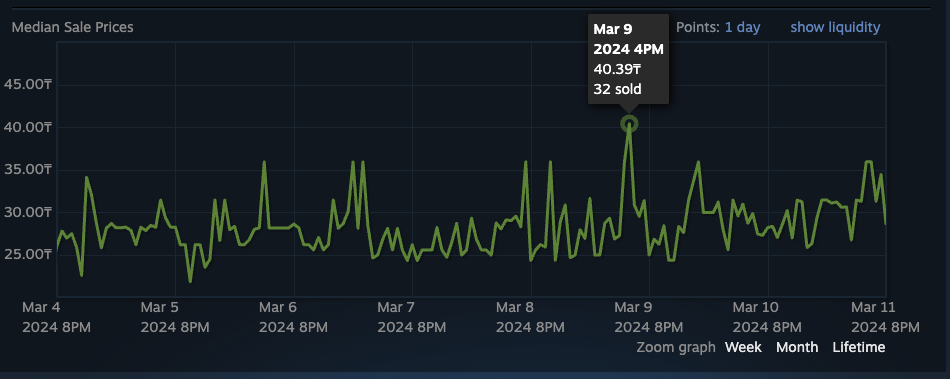
When opening an item in steam we can see the price history of the item like shown in the following image:

-
Notice that each point in steam may have different amount of sold items. This is
because steam groups all market transaction in an hour and then calculates the median price for that hour.
This is important to understand because it means that the price history graph in
steam is not a 1:1 representation of the actual price history of the item. The
graph shows the transaction in a way as if all of them would have amount of 1. -
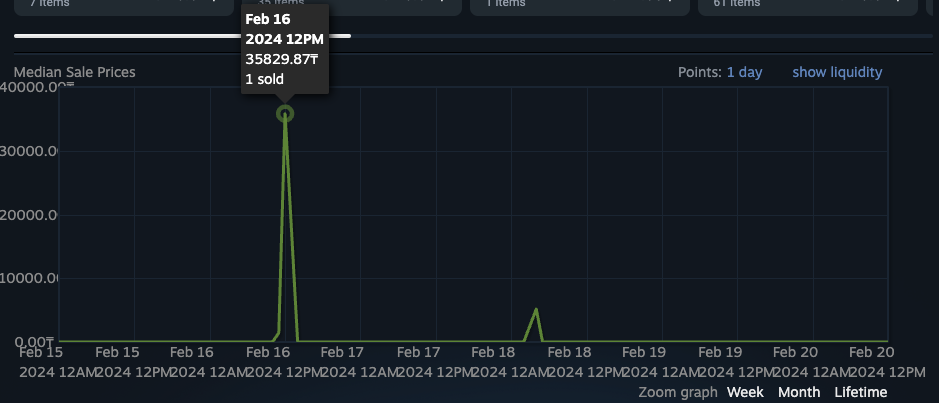
Because of scammers and people transfering money between accounts, the price
history graph may have some outliers. This means that some points may be
significantly higher or lower than the rest of the points. This is important to
understand because it means that the trend may be influenced by these outliers.
Obviously we don't want to respect these outliers when calculating the trend
and need to filter them out. (See image below)

Calculating the trend
Now that we understand the basics and the steam specifics we can calculate the trend.
For this we first take the price history of the item from steam for a specific
time amount (lets say last 24h) and parse it to
this format:
1[2{ date: 1708902000000, price: 48.724, amount: 1 },3{ date: 1708905600000, price: 84.237, amount: 2 },4{ date: 1708909200000, price: 47.906, amount: 1 },5{ date: 1708930800000, price: 48.724, amount: 2 },6{ date: 1708934400000, price: 21642.498, amount: 1 },7{ date: 1708938000000, price: 83.425, amount: 1 },8{ date: 1708945200000, price: 62.989, amount: 1 },9{ date: 1708959600000, price: 84.907, amount: 3 },10{ date: 1708970400000, price: 84.253, amount: 1 },11{ date: 1708977600000, price: 61.371, amount: 1 },12]
First filter out the line 6 because it is an outlier.
Then we calculate the trend using weighted linear regression. (We use the amount of each transaction as the weight).
On the x axis we count from 0 to n-1 where n is the number of transactions.
On the y axis we have the price of the transaction.
This results in following linear regression:
1{2equation: [ 0.6264977099236582, 63.62731755725193 ],3points: [4[ 0, 63.62731755725193 ],5[ 1, 64.25381526717558 ],6[ 2, 64.88031297709924 ],7[ 3, 65.5068106870229 ],8[ 4, 66.13330839694656 ],9[ 5, 66.75980610687022 ],10[ 6, 67.38630381679388 ],11[ 7, 68.01280152671754 ],12[ 8, 68.6392992366412 ]13],14string: 'y = 0.63x + 63.63'15}
Now we have two options on which information to pass to the api consumer.
- Return the equation ([ 0.6264977099236582, 63.62731755725193 ]). The first
value is called the slope and shows the increase or decrease of the price (x >
0 means increase while x < 0 decrease). The
second value is called the y-intercept and shows the price at the start of the time period. - Take the last point of the resulting linear regression, divide it by the first
point and return the percentage increase or decrease. (In this case it would be 68.63 / 63.62 = 1.0787)
Meaning that the price increased by roughly 7.87% in the last 24h.
Conclusion
This article explained the basics of trend calculation for steam items. It shows
only the basics and does not cover all the edge cases. Feel free to comment and ask questions if you have in our discord server.